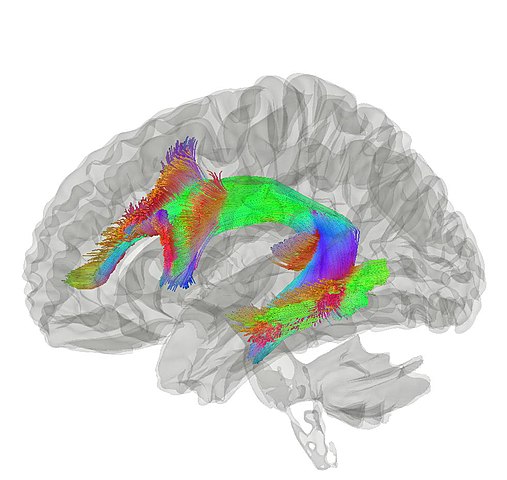
This data contains a sample of measurements from dMRI patients. dMRI measures the flow of water through the brain. After the image is processed, a trajectory tracking algorithm is applied to determine the direction of water diffusion. This leads to a collection of fasicles that connect different regions of the brain to each other. This data is for the fasicles that correspond to the Arcuate fascilicus shown below (Source: Wikipedia).
Details
This data contains two measurements:
The
positionalong the region, from one end to the other.The
faor "fractional anisotropy" a measurement of the amount of diffusivity.