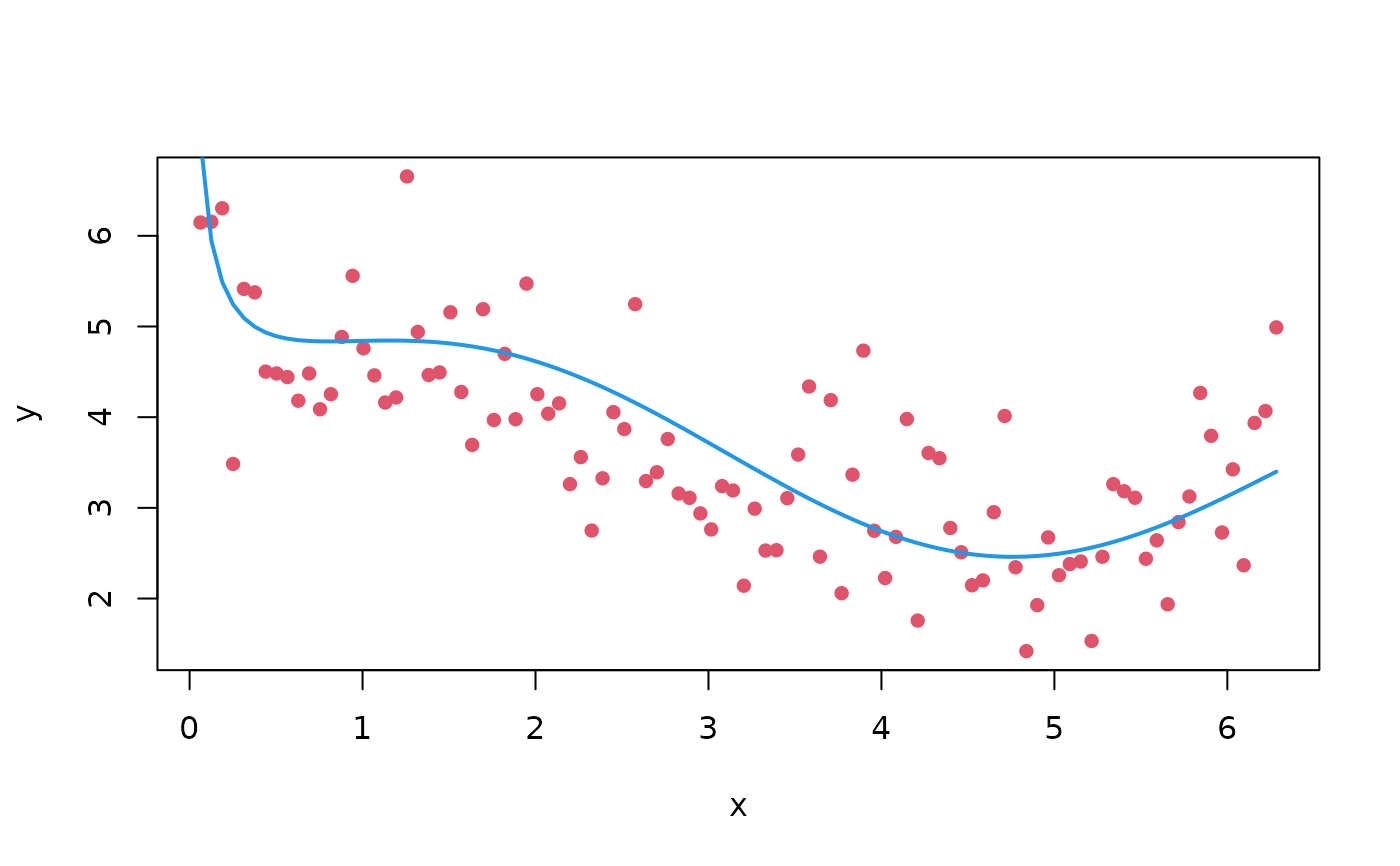
A small data set created using wiggly_function().
Examples
wiggly
#> # A tibble: 100 × 2
#>         x     y
#>     <dbl> <dbl>
#>  1 0.0628  6.15
#>  2 0.126   6.15
#>  3 0.188   6.30
#>  4 0.251   3.48
#>  5 0.314   5.41
#>  6 0.377   5.38
#>  7 0.440   4.50
#>  8 0.503   4.48
#>  9 0.565   4.44
#> 10 0.628   4.18
#> # ℹ 90 more rows
plot(wiggly, col = 2, pch = 16)
curve(wiggly_function(x), 0, 2 * pi, add = TRUE, col = 4, lwd = 2)